HyperFACETSv3 Storylines
Storylines are a physically self-consistent unfolding of past events and their plausible unfolding in the future (T. G. Shepherd et al., 2018). HyperFACETS employs storylines to guide our dialogue with regional collaborators, frame our efforts tackling deeper process understanding, and to motivate the evaluation of models far from the mean. They are a well-motivated context for scientific investigation since they refer to historical events or periods of significant socioeconomic impact that have been important for guiding stakeholder decisions and policy. Among available storylines, we are particularly interested in those events that stakeholders use for future planning (e.g., “model” events from a particular region) or those that have the greatest potential to shape stakeholder decisions. We are also interested in those storylines that are most significantly lacking in available data, those that have the greatest synergies across regions or impacted groups, and those where there is a need for deeper process understanding.

Wildfire in the Western US
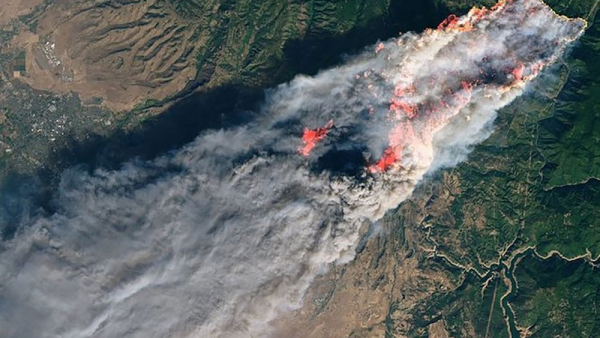
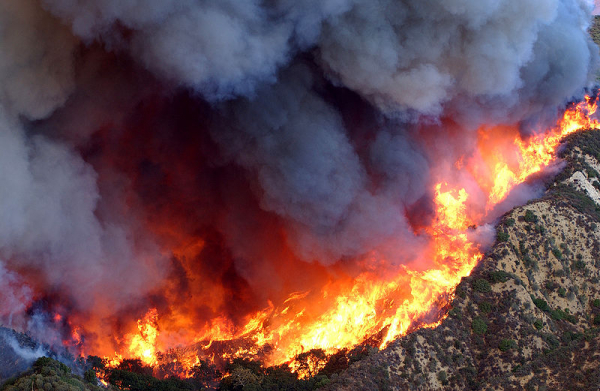 Since the 1980s, burned area in the western US has increased by a factor of five, with the largest increases occurring in California, Washington, Oregon, and Idaho. Fires are not only burning larger areas; they are also occurring more frequently. In recent decades, the Northwest, Southwest, and Rocky Mountain regions have shown an upward trend in the number of large wildfires burning simultaneously. Besides the wildland, urban areas in the western US (especially the Los Angeles area) have also been threatened repeatedly by major wildfire events. The wildfire season in the western US has started progressively earlier and lasted longer, extending into the fall season. The latter is driven by decreasing trends in fuel moisture in autumn under the compound effects of warmer temperatures, droughts, and large-scale meteorological patterns favorable for wildfires. In 2017 and 2018, increased autumn fuel aridity and warmer temperatures during dry wind events increased the likelihood of extreme fire weather indices by 40%. Lengthening of the fire season in the western US may increase the chance of the fire season overlapping with the severe weather season in the central US. By emitting enormous amounts of aerosols and sensible heat, large wildfires may affect severe weather environments and increase the occurrences of heavy precipitation and severe hail in downstream regions such as the central US. With warming and drying projected for the western US, wildfire risk will likely increase, with consequential impacts on human populations and ecosystems in the region and beyond. As part of this storyline we will address three key science questions:
- How may future changes in large-scale circulation and hydroclimate modulate regional changes in wildfire risk across the western US, including the occurrence of simultaneous wildfires across multiple regions?
- How may land-use and land-cover change alter future fire risk in urban areas through changes in the wildland-urban interface and urbanization impacts on fire spread and severity?
- What are the impacts of wildfires in the western US on convective severe storms and their attendant hazards (i.e., hail and lightning) in downstream regions?
Integrated Hydroclimate of California
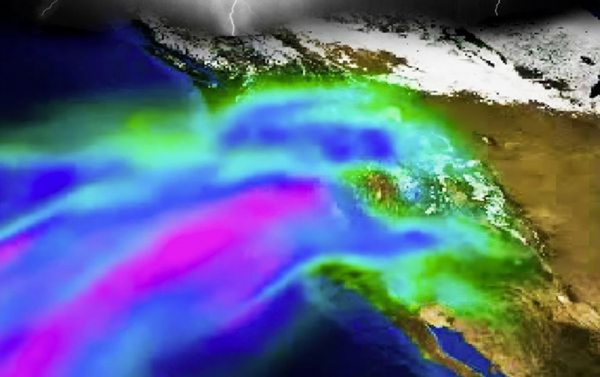
 California’s water resources are particularly vulnerable, as the state is characterized by very dry summers, with a significant fraction of its annual precipitation arising from a handful of intense and discrete atmospheric rivers (ARs) occurring from October through March. These ARs further exhibit substantial interannual variability. This produces a delicate balance between wintertime snow accumulation in the Sierra Nevada (providing ~1/3 of the state’s water supply) and summer season water resource availability, making the state especially susceptible to hydrologic drought. Under warming, risk of both flooding and hydrologic drought will likely increase as more wintertime precipitation occurs, and more of it falls as rain rather than snow. This could lead to net water resource loss as spring snowmelt is diminished; it is also known that streamflow from more punctuated and intense rain is more difficult to store. During all seasons, but especially summer, hydrologic and agricultural drought risk will likely be exacerbated by increased evaporative demand through warmer temperatures. Stakeholders and infrastructure planners seek information bounding projected changes in hydroclimate across California at decision-relevant scales. Thus, the scientific community is challenged to quantify the statistics and impacts of future dry and wet extrema. As part of this storyline we will address three key science questions:
- How and why does flood risk (including return time and character of major flood events) change in the future across the diversity of California watersheds?
- How and why does the risk and nature of multi-year hydrologic drought change across the state?
Aridity in the Colorado River Basin
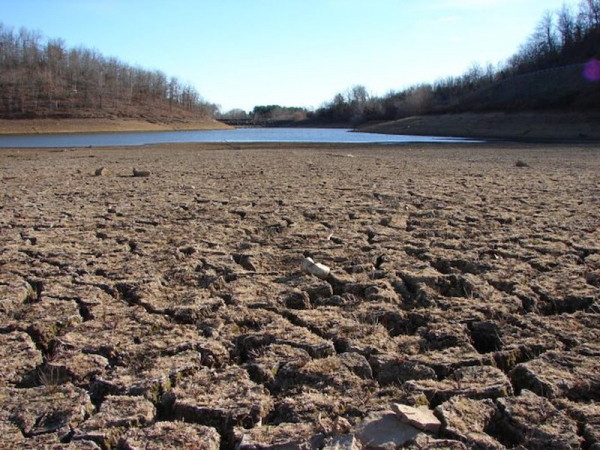
 The semi-arid western US is currently facing a major water crisis due to persistent and reportedly unprecedented drought conditions which started in the early 2000s. This crisis has many asking if the region is currently within a “megadrought”, a term which has historically been reserved for multi-decadal droughts that are evident in the paleoclimate records for the region. Megadrought is loosely defined, with a duration and intensity that exceeds human experience, but are projected to be more frequent and more widespread in a warming climate. Regardless, the ongoing drought has impacted the reliability of the Colorado River system to meet water allocation agreements and hydroelectric power generation targets and is perceived by some as a megadrought. Future rising temperatures and shifting precipitation from snow to rain could make streamflow harder to predict and water resources less reliable, and any precipitation increases that might occur, are likely offset by the impacts of warming temperatures. What if either the historical megadrought or current drought (e.g., 2020-2021) occurs in the future’s warmer climate when the evaporative demand of the atmosphere will be higher and precipitation will have shifted from snow to rain? What will this mean for water supply and hydroelectric power production? As part of this storyline we will address three key science questions:
- How well do we capture the hydrologic response to long-term or severe “megadrought” over the Upper Colorado in existing hydrologic and climate models? Explicitly, can climate model projections distinguish drought types between hydrological, meteorological, and snow drought, and better inform what is meant by the term megadrought?
- How do large-scale climate modes influence the rain-snow partition of storms and the persistence of dry snow droughts and wet-but-warm snow droughts over the Upper Colorado?
- Can we create skillful multi-year prediction and long-term projections of water resources in the Upper Colorado that capture megadrought and account for extreme low-flow conditions?
- To what degree can adaptive measures such as changes in reservoir operations, interbasin transfers, water conservation measures, etc. ameliorate the impacts of a future drought on water supply and hydroelectric generations, and overall reservoir and water system resilience?
Urban Flooding in the Northeast Corridor
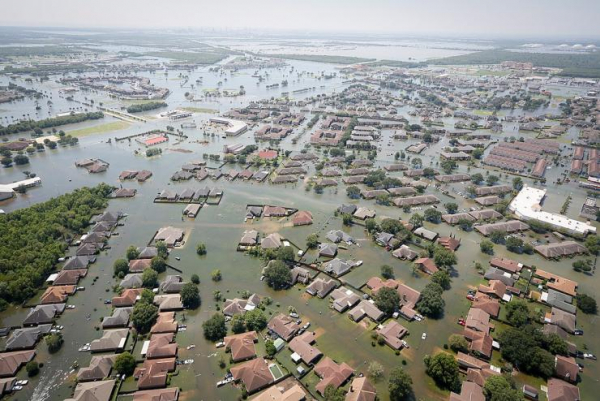
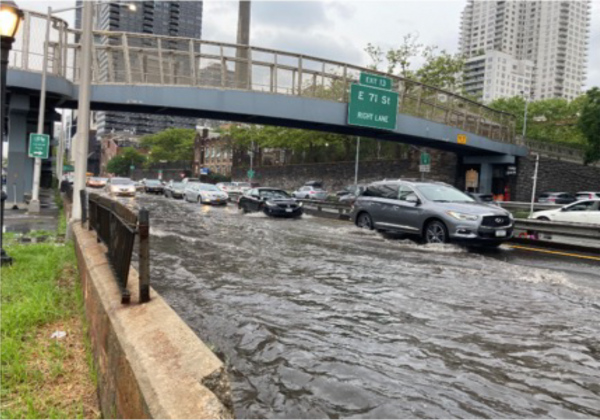 The devastation caused by Hurricane Ida over the Northeast USA is a recent example of human endangerment by urban flooding. The heavy downpour of the tropical storm resulted in 91 reported fatalities across nine states, including 13 in New York City (NYC) areas. In addition to this potential loss of life, urban flooding incurs significant financial strain owing to widespread damage to structures, transit systems, electrical systems, and more, bringing extensive costs to repair. Significant localized disruption of the NYC subway system and road transportation network occurred during Hurricanes Ida and Elsa. Such high intensity and high total rainfall events are expected to become more frequent in a changing climate.
Moreover, urbanization processes can change storm properties, and their interactions with synoptic processes may significantly impact local precipitation and climate. The juxtaposition of their space-time structure with the urban landscape and drainage systems (accounting for their reduced capacity due to blockages) determines the ultimate exposure of the population and assets to flooding. This storyline focuses on understanding and simulating such simultaneous or discrete exposures over the urban sewer/infrastructural networks that can inform operational responses, design evaluations, and testing of network failure probabilities. As part of this storyline we will address three key science questions:
- How do interactions among large-scale circulation and urban thermodynamic processes affect mesoscale and locally-driven convective systems and corresponding flooding and risk in the Washington-NYC corridor? How will those processes change under future land-use land-cover change (including urbanization) and warming scenarios?
- How do specific urban-scale initiatives or infrastructural plans affect flood risk to populations in the Washington-NYC corridor? What are the implications for particular neighborhoods or demographics?
- How can high-intensity rainfall simulations and storyline approaches more effectively assist urban planners and infrastructure experts understand the effects of future land use and infrastructure projects on overall community resilience and facilitate robust community engagement processes that educate residents and elected officials about their communities’ changing risk profiles under various future scenarios? How could these lessons be scaled up to inform multi-sector applications better related to urban flooding more broadly?
Winter Windstorms
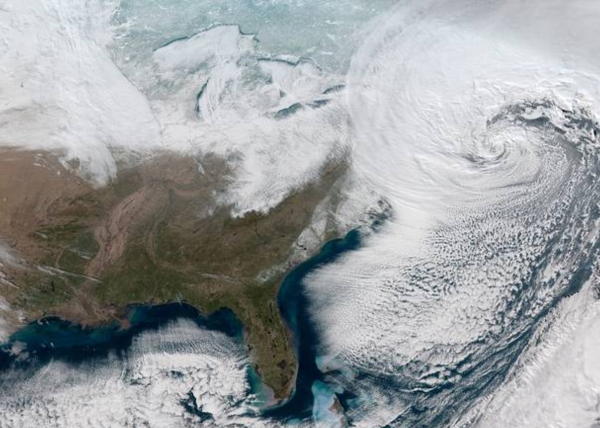
Winter windstorms are a leading cause of weather-related deaths in the US. The northeastern states exhibit a very high prevalence of intense cyclones that are associated with damaging winds and other hazards (e.g. heavy rain, snow). Previous work under the HyperFACETS project showed the top 10 historical cold-season windstorms resulted in property damage in the Northeastern states of over US $35 billion. While detection and attribution of changes in intense winter windstorms are challenging, there is evidence that intense winter wind speeds in the mid-latitudes have increased since 1950, due in part to increased frequency of intense extratropical cyclones. Our current research is designed to quantify: First, how accurately we can simulate winter windstorms and their associated hazards (high and severe wind speeds, and precipitation). Second, how such events may respond to changes in the broader environment. And third, how human exposure to such events may change as the population changes.
Freezing Rain and Icing
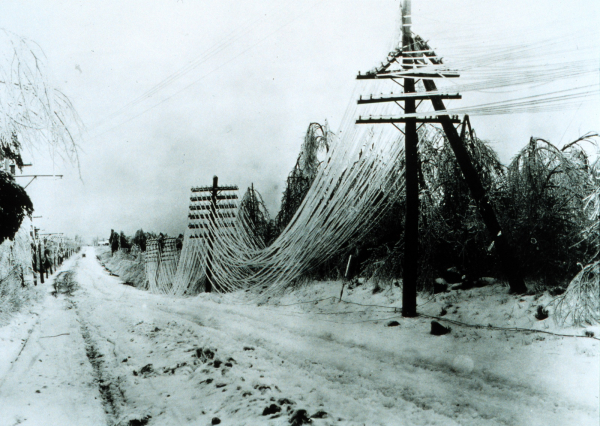
Long-duration, spatially-extensive freezing rain events are prevalent over the eastern US and are most frequent in the US Northeast. These events represent an important atmospheric hazard and have impacts on i) travel, particularly for airplanes and road vehicles; ii) infrastructure, including electric supply lines and wind turbine operation; and iii) vegetation, both forested and cropland. The US Department of Homeland Security, National Protection and Programs Directorate have identified freezing rain and icing events as a threat to critical energy and transport infrastructure if they lead to accumulation of approximately 5 mm on exposed surfaces. One particularly damaging event occurred 5-9 Jan 1998 and impacted an area extending from Northern New York across much of New England and the eastern provinces of Canada. This extreme icing event led to accumulations of 100 mm and accreted radial ice thickness of 45 mm on some power lines and other electricity distribution infrastructure. Associated damages were estimated to be US$ 4.4 billion (in 2005 US dollars). Freezing rain and icing is particularly challenging to simulate because it is caused by supercooled rain droplets freezing on contact with surfaces, requiring complex thermodynamics in the presence of miniscule temperature gradients. Our proposed activities will address the following key science questions:
- How frequent are freezing rain and compound high-impact events associated with freezing rain/icing and high winds in the contemporary climate?
- How consequential are freezing rain events in terms of the risk to current and future electric infrastructure including power distribution (power lines) and power generation (wind turbines)?
- Is it possible to make projections using either machine learning approaches or simple inferential methods applied to climate model output to examine how the geospatial pattern of the associated atmospheric hazard may evolve in the future?
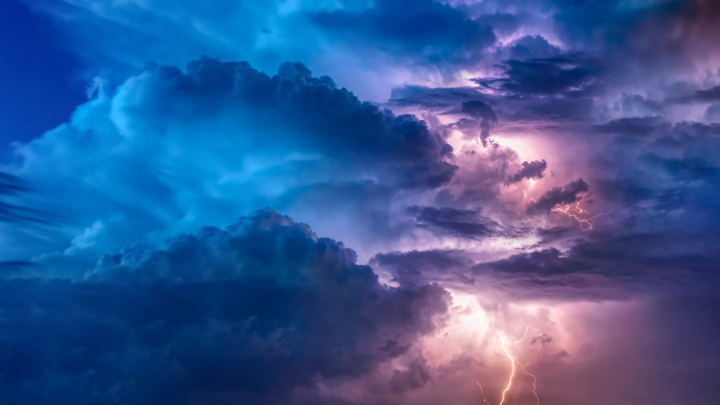
North American Derechos, Mesoscale Convective Systems and Convective Winds
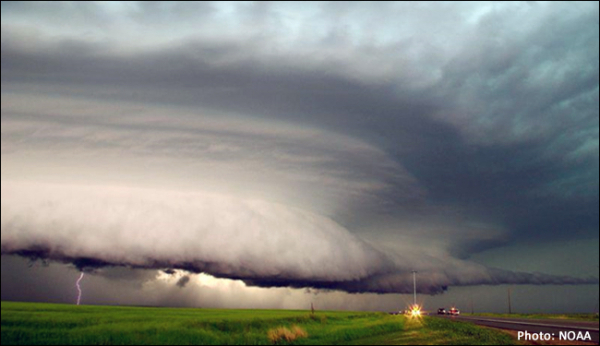 Mesoscale convective systems (MCSs) are organized thunderstorm complexes that can persist from hours to days, bringing destructive precipitation and winds. MCSs occur about twenty times per year in the Great Plains and the eastern US, with the largest MCSs occurring frequently in the spring seasons. MCSs produce seven times more intense rainfall than other types of rainfall in the central US in the warm season. Strong wind-producing MCSs are commonly related to quasi-linear MCS (QLMCS) with a leading convective line, particularly those with a “bow echo” structure of intense convective features that often manifest in derechos. Hence MCSs are responsible for spawning convective windstorms that are among the most destructive weather hazards at mid-latitudes. For example, the 2012 North American derecho, also known as the “Ring of Fire Derecho” and associated with a large QLMCS, passed through nine states from Indiana to New Jersey and resulted in US$ 2.9 billion in damage and loss of power for millions, with wind speeds in excess of 40 m/s (90 mph). The August 2020 derecho, another QLMCS-associated case, exhibited torrential rain and hail, along with wind speeds in excess of 60 m/s (130mph) and was consequently responsible for over US$ 11 billion in damage, including affecting more than 40% of Iowa’s corn and soybean crops. The science questions addressed in this storyline are as follows:
- What environments are favorable to QLMCSs that produce extreme winds and what processes are critical for QLMCSs to develop into derechos?
- How may derecho-producing MCSs change across the central to eastern US in response to future warming, land-use change, and particularly urbanization?
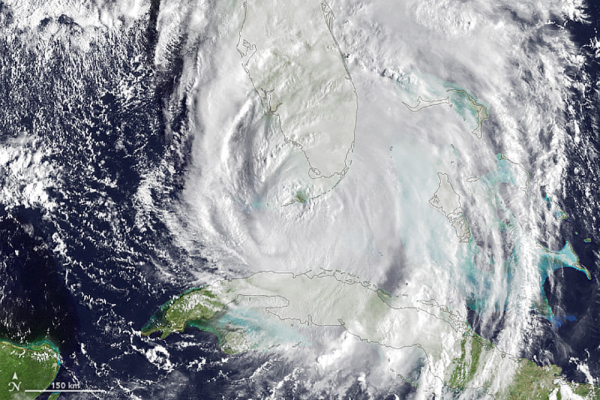
Worst-Case Hurricane Tracks
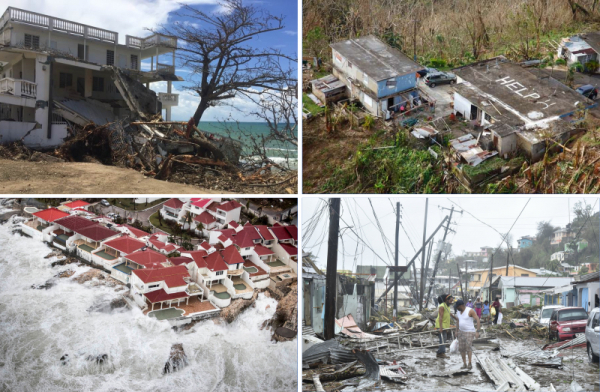 Landfalling hurricanes produce intense winds, heavy rain, high waves, and damaging storm surge in coastal locations and are among the most costly and deadly geophysical extremes. The 2020 North Atlantic hurricane season was a clear example of the destruction these storms can inflict on coastlines throughout North America and the Caribbean. Other examples, Hurricane Irma (2017) and Dorian (2019), threatened to make landfall in the Miami, Florida metropolitan area as major hurricanes until adjusting course in the final days leading up to landfall. Although they impacted other regions, these events were near misses which avoided “worst-case scenarios” for Miami. While considerable advances have been made in improving track forecasts, uncertainty still remains in predicting where – or even if – a storm will make landfall multiple days in advance, and different coastal cities, including throughout Florida, use different historical storms (i.e., “storms of record”) for planning purposes. However, there remains uncertainty in the frequency of hurricanes, particularly at the regional level, and the magnitude of precipitation change. For this work we use a storyline approach focused on “worse-case” trajectories to quantify the storm characteristics, particularly extreme precipitation, that have threatened Florida, particularly Miami, over the last 10 years. This, as well as how they might be different under future warming scenarios, offers new insights into better understanding the future impacts of hurricanes on coastal environments. The science questions addressed in this storyline are:
- Considering the near misses of Hurricanes Irma or Dorian, how might Miami have been impacted (rainfall, wind, etc.) if these storms had made landall there as initially forecasted?
- Are there plausible environmental states (sea surface temperatures and atmospheric conditions) that could offer extreme outcomes that would be useful for risk mitigation and planning purposes?
Compounding Effects from Tropical Cyclones
 The Impacts of landfalling tropical cyclones can be highly dependent on antecedent conditions. For example, a wet spring may result in saturated soil and high water tables, providing a greater risk of storm-induced flooding than may otherwise be present. The Southeastern US in particular is known to be hydrologically dominated by groundwater and saturation excess due to thick and highly permeable soil. Similarly, the passage of multiple cyclones over the same geographic region in close succession can greatly amplify hazards associated with the trailing storms above an isolated landfall. One recent example occurred in 2011, when Tropical Storm Lee followed a similar path to Hurricane Irene over the mid-Atlantic and Northeastern United States. While Lee was not a system of notable intensity, flooding associated with it was considerable due to heavy rainfall on already saturated soil and swollen rivers – all told, damage estimates reached US$ 2.8 billion. Another more recent event was 2020’s Hurricane Eta, which caused flooding in Broward County, Florida that was amplified by an already elevated water table. The science questions addressed in this storyline are:
- How do the threshold exceedances (i.e., “tipping points”) that lead to compounding hazards change under different climates?
- How hydrologically susceptible are regions to sequential storms and how “close” is “too close” in space and time?
- Can simulated groundwater storage, either from a traditional model or a novel learnable model, improve the predictability of flood magnitudes and explain the compounding effects?
HyperFACETSv2 Storylines

Hydroclimatic Priming of the 2018 California Wildfires
 Following an aberrant 5-year drought stretching from 2011-2016 and subsequent abrupt shift to very wet conditions during 2017, California experienced one of its most devastating years of wildfire in 2018. This year recorded both the largest fire (the Mendocino Fire Complex) and deadliest fire (the Camp Fire) on record. Increase in fuel from trees and favorable meteorological and climatic conditions, including high temperatures, dry soils, and the gusty and dry Diablo winds, have been attributed to the extreme wildfire season. Future changes in climate and land use land cover may fundamentally alter the fire regimes in California, with subsequent influence on the hydrologic impacts of wildfires. For example, warmer temperatures and heat-related droughts have been projected to become more common in the future. Earlier snowmelt and potentially reduced snowpack in a warmer climate may exacerbate agricultural (soil moisture) and hydrological (streamflow) drought to create more favorable conditions for wildfires. Analyses supported by FACETS and Hyperion found a robust increase in subseasonal precipitation variability during winter in North America in the future, with particularly large changes over California, manifesting in an intensified swing between wet and dry extremes. The teams also found a robust change in precipitation seasonality over California in the future that features a sharpening precipitation seasonal cycle, with increased winter precipitation and reduced fall and spring precipitation. Fall/spring drying has already been detected in the observational record and the Coupled Model Intercomparison Project (CMIP5) models show a “time of emergence” for the seasonality change of around 2022. We noted that increasing land-sea temperature contrast, and hence moisture contrast, is a key mechanism for the fall/spring drying. Meanwhile, the eastward extension of the jet stream is contributing to the increased winter precipitation. The drying in fall and spring, which coincides with the seasonality of the Diablo winds, may have important implications for prolonging the fire season in the future. (Lead: Ruby Leung)
Sequential AR events in California based on the 1861-62 flood
 The 1861-62 winter was associated with intense precipitation in Northern California over a period of 43 days, capped by a warm storm event that produced historical flooding of the Sacramento Valley. The precipitation that drove this megaflood event was delivered by what is known as the “ARkStorm,” a sequence of series of particularly intense atmospheric rivers (ARs). ARs are responsible for delivering huge amounts of precipitation over California during the cold-season, and are often associated with floods over this region. Under warmer climates, thermodynamic effects are projected to intensify ARs — a warmer atmosphere can hold more water vapor that translates into increased large-scale precipitation. Dynamically downscaled simulations of individual future extreme ARs over California, conducted through the Hyperion Project, support this notion. Initial results indicate that by late-century, California may experience extreme ARs without precedence of the recent past. In a much warmer climate, precipitation from these storms will be mostly delivered as rain instead of snow, and potentially make landfall during snow melt events. Together, these processes conspire to produce a “double whammy” of extreme runoff, with the potential to overwhelm dams and levies, and inundate towns and farms. (Lead: Alex Hall)
Hurricane Irma
 In 2017, multiple Atlantic hurricanes caused vast destruction along U.S. coastlines through different combinations of wind, inland flooding, and storm surge. Forming from a tropical wave originating over Africa, Hurricane Irma intensified quickly to major hurricane strength over the North Atlantic ocean. As the storm tracked westward into the Caribbean, favorable conditions enabled the storm to develop into a powerful Category 5 storm with a maximum intensity of sustained winds of 80 m/s. After direct landfalls on various Caribbean islands, Hurricane Irma’s path steered toward the Gulf and Florida coast, making landfall in Southern Florida as a Category 4 hurricane, before weakening inland of the Florida peninsula. Irma’s intensity, size and track proved to be a devastating combination for the region, leading to 10 direct storm-related fatalities and $50 billion in damage in the U.S. Hurricane Irma is an example of the diversity of impacts coastal storms can inflict on U.S. coastlines. Understanding how warming may influence these impacts is important in the decision context. Though the impact of a hurricane depends in part on the peak wind speed of the storm, the size and structure of the wind field are also crucial determinants of the spatial and temporal distribution of these hazards. Irma was a large storm, meaning its wind field, including the extent of hurricane force winds, extended far from the storms center, further worsening its destructive potential. Heavy rains of over 12 inches in large portions of Florida caused extensive urban flooding, as well as fluvial flooding in Irma’s aftermath. (Lead: Kevin Reed)
Repeated Passages of MCSs over the Southern Great Plains
 The U.S. Southern Great Plains (SGP) experienced record-breaking flood events in May 2015. Precipitation started to spike in the beginning of May and persisted for the rest of the month with a series of MCSs passing through the region. The repeated passages of MCSs and soil saturation from rainfall of the previous month culminated in the worst statewide flooding on record in Texas. A semi-stationary trough over the western U.S. that funneled Gulf of Mexico moisture into the SGP supported the MCSs and exacerbated the extreme rain. The May 2015 floods in the SGP exemplify a “perfect” alignment of seasonality (spring jet stream) and interannual variation (a strong El Nino) for inducing and sustaining MCSs, with an additional push from the warming climate that increased moisture content and modulated quasi-stationary Rossby waves that drive subseasonal wet-dry alternations.
In the future, the May 2015 floods may unfold differently with further changes of the climate system. For example, the projected, seasonally-dependent response of the Hadley circulation and subtropical highs to warming would strengthen the low-level jet (LLJ) more in spring than summer, which may enhance spring MCS precipitation in the future. A strengthening of the LLJ and enhancement of MCS lifetime and extreme precipitation have already been observed in the past decades. On the contrary, a poleward shift of the mid-latitude jet stream and expansion of the North American monsoon anticyclone may lead to summer drying in the SGP in the future. Understanding the mechanistically robust local and remote factors that contribute to the spatiotemporal clustering of MCSs conducive to flooding is critical for projecting future changes in flood potential in the SGP. Strong winds that often accompany MCSs are another important but poorly-understood feature of these events, with potential impacts on regional energy production. (Lead: Ruby Leung)
Rain-on-Snow Flooding in the Susquehanna
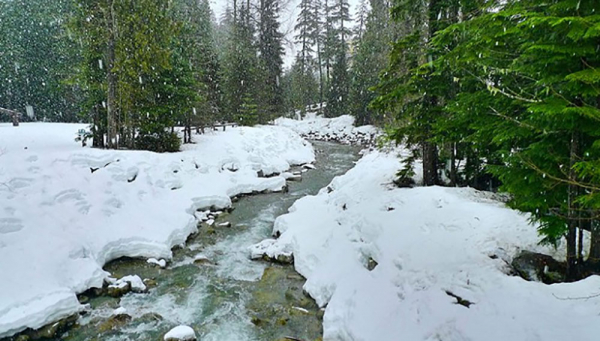 In late January 1996, the Susquehanna River basin experienced some of its highest streamflows in recorded history. This unique occurrence was driven by an extratropical cyclone (ETC) advecting anomalous warmth and producing heavy rainfall, which rapidly ablated a deep antecedent snowpack. This “rain-on-snow” event caused catastrophic flash flooding over a wide region, with extreme runoff volumes being exacerbated by ice jams resulting from previous cold and snowy weather. More than 150 deaths and $4.9 billion (inflation adjusted) in damages were reported, making this one of the costliest wintertime weather events in U.S. history.
Recent work projects significant shifts in precipitation frequency, rates, and phase (i.e., rain versus snow) associated with ETCs (e.g., atmospheric rivers, nor’easters, etc.) over the U.S., implying significant hydrological challenges associated with infrastructure designed around 20th century climate. While rain-on-snow has begun to be explored in a broader climate context in recent years, gaps still exist in our process-level understanding of the interplay between snowpack, runoff, precipitation, and other land-atmosphere variables during these events. For instance, the vast majority of previous research has been limited to mountainous regions, and does not consider ephemeral snowpack more common to regions such as the northeastern U.S. (Lead: Colin Zarzycki)
Wind Storms in the U.S. Northeast
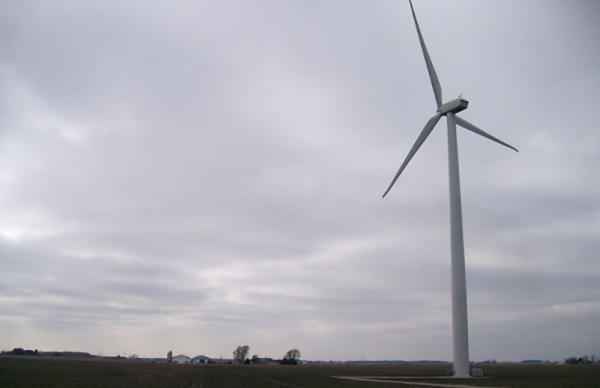 In recent decades there have been examples of extreme wind storms in the U.S. northeast, including two particularly intense nor’easters that occurred during 2000 (one peaked on 21 January 2000 and another on 18 December 2000 (selected based on data from the NOAA storm event reports). Since the aerodynamic force exerted by the wind scales with the square of the wind speed, thus wind extremes (including gusts) are an important natural hazard. Over the Northeastern U.S. (which is frequented by intense cyclones), the sources of wind extremes are intense mid-latitude cyclones such as Alberta Clippers and nor’easters coupled with other weather extremes (e.g., blizzards); these storms tend to impact densely populated areas. These storms are also sensitive to changes in ice cover over the Great Lakes, but changes to wind extremes in light of reduced ice cover remains a topic of future study. (Lead: Sara Pryor)
The 1960s Northeastern U.S. drought
 The 1960s drought in the U.S. Northeast, occurring approximately over the period 1962-1966, had pronounced implications for water management practices in this region. From 1962 to 1966, 34 out of the 46 months had below average precipitation, and by April 1966 the water shortage in this region was over 36 inches, almost equaling one year’s rainfall. Tree-ring reconstructions showed that this drought had been the most severe of the last few centuries — although other droughts had occurred over longer periods. An analysis of the synoptic-scale patterns present at the time of the drought suggested connections with the North Pacific Mode and the North Atlantic Oscillation.
Notably, the 1960s drought period was associated with below average temperatures — warmer temperatures since the 1960s and shifts in precipitation patterns have potentially modified the probability or character of an analogous drought event. Further, changes in land use and water demand in the region have affected the infrastructural and socioeconomic needs of this region. These reported changes suggest that existing policies based on this earlier drought may now be insufficient for future planning. (Lead: Paul Ullrich)
Colorado’s Spring Miracles
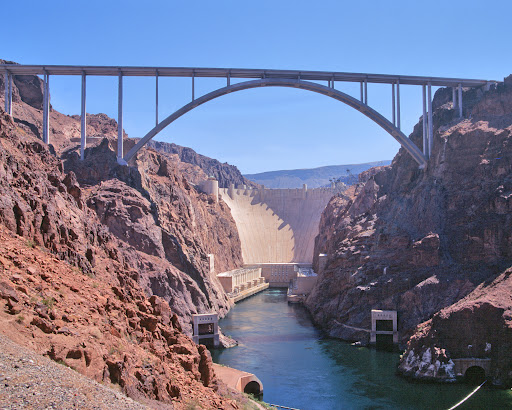
 Historically dry winter seasons have sometimes been saved in the Spring by extraordinarily intense precipitation over short periods of around a month. A famous example of these events include the Miracle May of 2015, occurring after a prolonged and severe drought over the water year — when Colorado water supply was down to dangerously low levels prompting concerns from dam operators. In Lake Mead the water level had fallen to lows not seen since the Hoover Dam was built in the 1930s. Officials had prepared for drastic water cutbacks to stakeholders and water users. But a rainy May 2015 drove a dramatic increase in streamflow and filled most dams. Other famous spring miracles include Miracle March 2003 and Miracle March 1991.
These miraculous months are inevitably connected to questions of climate variability and predictability. With increases in variability expected through the remainder of the 21st century, there is a growing need to understand the frequency and character of events of this nature. (Lead: Simon Wang)
